security-overview

Subscribe to all “security-overview” posts via RSS or follow GitHub Changelog on Twitter to stay updated on everything we ship.

~ cd github-changelog
~/github-changelog|main git log main
showing all changes successfully

Gain valuable insights and effectively monitor your enterprise’s security landscape and progress with two new enterprise-level pages: the security overview dashboard and secret scanning metrics.

New overview dashboard on the security tab at the organization level

Key features

  • Customizable filters: Select specific time periods and focus areas such as security tool, team, or custom repository property.
  • Comprehensive data: Trending and snapshot data provide a robust security landscape overview.
  • Detailed metrics: Includes metrics such as the average age of security alerts, mean time to remediate, and push protection statistics.

To access these new enterprise-level views, navigate to your enterprise account. In the enterprise account sidebar, click Code Security. The new pages are accessible to organization owners and organization security managers, with data scoped to the repositories and alerts you have access to.

These two pages are now available as a public beta on GitHub Enterprise Cloud and will be available in GitHub Enterprise Server 3.14.

Learn more about security overview, managing code security for your enterprise, and send us your feedback

Questions or suggestions? Join the conversation in the community discussion.

See more

The new Tool group-by option on the security overview trends graph provides a visualization of alert trends, organized by the security tools that detected each vulnerability. It’s designed to improve your ability to track and analyze the effectiveness of your scanning tools, enabling more strategic decision-making.

Example of the alert trends chart grouped by security tool

With this new functionality, you can:
* Pinpoint which tools are detecting the most critical vulnerabilities.
* Monitor the performance of your scanners over time.
* Prioritize your remediation efforts based on detailed insights.

To access this feature, navigate to the Security tab at the organization level on GitHub, and choose the Tool option in the Group by dropdown.

This functionality is now available as a public beta on GitHub Enterprise Cloud and will be available in GitHub Enterprise Server 3.14.

Learn more about the security overview dashboard for your organization and send us your feedback

See more

For enterprise owners and security managers dedicated to managing security products, we are excited to announce a new capability: you can now gain historical insights into security products enablement trends across your GitHub enterprise. This overview helps you understand how security product coverage is being implemented across your company.

Following our March announcement of the public beta of the enablement trends report for organizations, which allowed monitoring of enablement trends for all security products within your GitHub organization, we’ve expanded this capability to the enterprise level. The addition of an owner filter further simplifies the navigation of metrics for repositories owned by specific organizations.

Enterprise enablement trends report

Explore enablement trends and gain historical insights into the activation status of GitHub security features:
* Dependabot alerts
* Dependabot security updates
* Code scanning
* Secret scanning alerts
* Secret scanning push protection

Historical data is available from January 1, 2024, with the exception of Dependabot security updates data, which is available from January 17, 2024.

To access the enablement trends report, navigate to your enterprise account. In the enterprise account sidebar, click Code Security.

This feature is now available as a public beta on GitHub Enterprise Cloud and will be available in GitHub Enterprise Server 3.14.

Learn more about security overview and join the discussion within the GitHub Community

See more

Today, we’re releasing security tool-specific filters for the security overview dashboard and secret scanning metrics page.

Security tool-centric filters in the filter bar drop-down on the overview dashboard

Have you ever wondered, “How well is my organization handling SQL injections?” or “How quickly are we responding to [partner name] secret leaks?” Maybe you’re curious about the pace of updating your npm dependencies. Well, wonder no more!

With our new security tool filters, you can tailor your search to the exact details you’re curious about, giving you a more focused and relevant report for your needs.

Discover the new filters that are designed to transform your security analysis:

  • Dependabot filters: Zero in on a specific ecosystem, package, and dependency scope.
  • CodeQL/third-party filters: Drill down to the rule that matters most to you.
  • Secret scanning filters: Get granular with filters for secret type, provider, push protection bypassed status and validity.

These features are now available as a public beta on GitHub Enterprise Cloud and will be available in GitHub Enterprise Server 3.14.

Learn more about security overview and send us your feedback

See more

Today, we’re releasing a host of new insights to the security overview dashboard, as well as an enhanced secret scanning metrics page.

New dashboard insights

overview dashboard with third-party tools, the trend indicator for age of alerts, and reopened alerts tile highlighted

  • Third-party alerts integration: Beyond GitHub’s own CodeQL, secret scanning, and Dependabot security tools, you can now view alert metrics for third-party tools directly on the overview dashboard. Use tool:[third-party-tool name] to view metrics for a specific third-party security tool, or tool:third-party to view metrics for all third-party security alerts.
  • Reopened alerts tracking: Uncover recurring vulnerabilities with the new reopened alerts metric tile, which identifies vulnerabilities that have resurfaced after being previously resolved. This data point helps assess the long-term effectiveness of your remediation efforts.
  • Trend indicators: Review changes over time with trend indicators for key metrics like age of alerts, mean time to remediate, net resolve rate, and total alert count. These indicators offer a clear view of performance shifts and trends between a given date range and that same range reflected backward in time.
  • Advisories tab: Stay informed with the new advisories table, which details the top 10 alert advisories affecting your organization, including the advisories’ CVE IDs, ecosystems, open alert counts, and severities.

Secret scanning metrics page enhancements

secret scanning metrics page with filter bar highlighted

You can now refine your insights with filters for dates, repository custom properties, teams, and more on the secret scanning metrics page. These new filters empower you to pinpoint specific repositories and view changes over time, enabling a more targeted analysis. Additionally, if you are an organization member, you can now view metrics for the repositories you have access to.

These features are now available as a public beta on GitHub Enterprise Cloud and will be available in GitHub Enterprise Server 3.13.

Learn more about security overview and send us your feedback

See more

Starting today, you can take advantage of the new “age” grouping for the alert trends graph and explore enhanced filter options on the security overview dashboard, aimed at improving your analytical process and security management.

alert trends grouped by age

Explore the dynamics of your security alerts with the new alert age grouping on the alert trends graph. This new functionality offers a refined view into the lifecycle of your security alerts, enabling you to better evaluate the timeliness and effectiveness of your response strategies.

New filter options

repository custom property filter on the security overview page

Leverage enhanced filters to fine-tune your security insights on the overview dashboard:
* Custom repository property filters: With repository custom properties, you can now tag your repositories with descriptive metadata, aiding in efficient organization and analysis across security overview.
* Severity filters: Severity-based filters allow you to concentrate on the vulnerabilities that matter most, streamlining the process of security risk assessment and prioritization.
* Improved date picker controls: Navigate through time with ease using the new date picker options, allowing for quick selection of rolling periods like “Last 14 days,” “Last 30 days,” or “Last 90 days.” Bookmark your preferred time window to keep your analysis current with each visit.

You can access these new functionalities in security overview by navigating to the “Security” tab at the organization level.

These features are now available as a public beta on GitHub Enterprise Cloud and will be available in GitHub Enterprise Server 3.13.

Learn more about security overview and send us your feedback

See more

Code scanning autofix is now available in public beta for all GitHub Advanced Security customers. Powered by GitHub Copilot, code scanning suggests fixes for Javascript, Typescript, Java, and Python alerts found by CodeQL.
This feature empowers developers to reduce the time and effort spent remediating alerts found in pull requests, and helps prevent new vulnerabilities from being introduced into your code base.

Autofix

The feature is automatically enabled on all private repositories for GitHub Advanced Security customers.
When code scanning analysis is performed on pull requests, autofixes will be generated for supported alerts. They include a natural language explanation of the suggested fix, together with a preview of the code suggestion that the developer can accept, edit, or dismiss. In addition to changes to the current file, these code suggestions can include changes to multiple files. Where needed, autofix may also add or modify dependencies.

You can see the total number of autofix suggestions provided for CodeQL alerts in open and closed pull requests in security overview:

Autofixes on the overview dashboard

You can configure code scanning autofix for a repository or organisation. You can also use Policies for Code security and analysis to allow autofix for CodeQL code scanning for an enterprise.

Enterprise settings

Code scanning autofix supports, on average, 90% of CodeQL Javascript, Typescript, Java, and Python alerts from queries in the Default code scanning suite. The fix generation for any given alert also depends on the context and location of the alert. In some cases, code scanning won’t display a fix suggestion for an alert if the suggested code change fails syntax tests or safety filtering.

This change is now available to all GitHub Advanced Security customers on GitHub.com. For more information, see About autofix for CodeQL code scanning.

Provide feedback for code scanning autofix here.

See more

You can now monitor enablement trends for all security products within your GitHub organization. This functionality is designed to give you a detailed overview of how your organization is implementing security product coverage.

new tool adoption report

Explore enablement trends for historical insights into the activation status of GitHub security features:
* Dependabot alerts
* Dependabot security updates
* Code scanning
* Secret scanning alerts
* Secret scanning push protection

Historical data is available from January 1, 2024, with the exception of Dependabot security updates data, which is available from January 17, 2024.

To access the enablement trends page, visit security overview at the organization level. You can find security overview by clicking on the “Security” tab.

This feature is now available as a public beta on GitHub Enterprise Cloud and will be available in GitHub Enterprise Server 3.13.

Learn more about security overview and join the discussion within the GitHub Community

See more

Banner announcing the new overview dashboard states prioritization made simple with security insights

A new asset in security management is now available for GitHub enterprise users. Reinforcing the “shift left” philosophy, this feature is designed to integrate security into the heart of the development lifecycle, empowering your organization to proactively identify and address vulnerabilities.

Key advantages

Historical context

By comparing historical and current data, you can visibly track improvements in your security landscape and demonstrate the value of security investments.

Reporting period drop-down menu for the new overview dashboard

Customized focus

Sharpen your focus with filters that dissect your security data by teams, repositories, or any categorization that aligns with your goals. Whether it’s tracking team performance or monitoring metrics across a core group of repositories with the repository topic filter, there’s a plethora of options available to meet your needs.

Drop-down of filters for the new overview dashboard

Prioritization made simple

With clear insights into severity and net resolve rate—security’s version of developer velocity—the dashboard shows you if your resources are aligned with the most severe threats and if remediation speed is in harmony with security demands.

Security alerts trends graph grouped by severity and the net resolve rate tile from the new overview dashboard

Strategic alignment

Gain a strategic perspective with the Repositories “Top 10” list, which shows you repositories with the largest number of open alert counts, to understand where to direct your attention first.

Repositories top 10 list from the new overview dashboard

Shift left

The dashboard, which is accessible by everyone in the organization, helps you drive best security practices by understanding potential issues as early as possible, reducing risk and workload down the line.

New overview dashboard

This overview dashboard is now available as a beta on GitHub Enterprise Cloud and will be available in GitHub Enterprise Server 3.13.

Learn more about the new overview dashboard and send us your feedback

See more

Organization owners and security managers can now view metrics associated with push protection usage across their organization.

The overview shows a summary of how many pushes containing secrets have been successfully blocked across the organization by push protection, as well as how many times push protection was bypassed.

You can also find more granular metrics, including:

  • the secret types that have been blocked or bypassed the most
  • the repositories that have had the most pushes blocked
  • the repositories that are bypassing push protection the most
  • the percentage distribution of reasons that users give when they bypass the protection

These metrics are found under the Security tab of your organization and are based on activity from the last 30 days.

screenshot of push protection metrics, showing overall secrets blocked and details on most blocked types, repositories with most pushes blocked, and bypassed secret metrics

See more

You now have the option to select either the "Extended" or "Default" query suite when setting up code scanning with default setup for eligible repositories within your organization.

The multi-repo enablement panel on the security coverage page with a focus on code scanning enablement and the new query suite selection menu

Code scanning's default query suite has been carefully designed to ensure that it looks for the security issues most relevant to developers, whilst also minimizing the occurrence of false positive results. However, if you and your developers are interested in seeing a wider range of alerts, you can enable the extended query suite. This suite includes everything from the default query suite, plus additional queries with slightly lower precision and severity.

Choose a query suite

The query suite selection can be made whenever you enable code scanning with default setup:

  • When using "Enable all" on the organization settings page.
  • When enabling a single or multiple repositories on the security coverage page.
  • When enabling on a repository's settings page.
  • When using the "Enable or disable a security feature for an organization" endpoint.

Previously, our system would automatically choose the default query suite when you enabled code scanning with default setup. Now, you can choose either the extended or default query suite.

Recommend a query suite

Additionally, you can specify either the extended or default query suite as the preferred choice for your organization. This preference determines which query suite is "recommended" when a user is enabling code scanning setup with default setup.

The recommended setting for code scanning query suites and the resulting recommended tag on the organization settings page

These improvements have shipped to GitHub.com and will be available in GitHub Enterprise Server 3.11.

Learn more about configuring default setup for code scanning and send us your feedback
Learn more about GitHub Advanced Security

See more

With GHES 3.9, you and your organization can better manage your Dependabot alerts thanks to more granular enablement controls. You can now enable Dependabot alerts at the repository, organization, and enterprise level, rather than having to enable Dependabot alerts across an entire enterprise at once.

This release also adds support for “automatically enable for new repositories” at the organization and enterprise levels.

Enterprise admins still need to opt in to Dependabot alerts via GitHub Connect, which approves outbound calls for advisories to sync.

Learn more about changes for GHES 3.9 for Dependabot.

See more

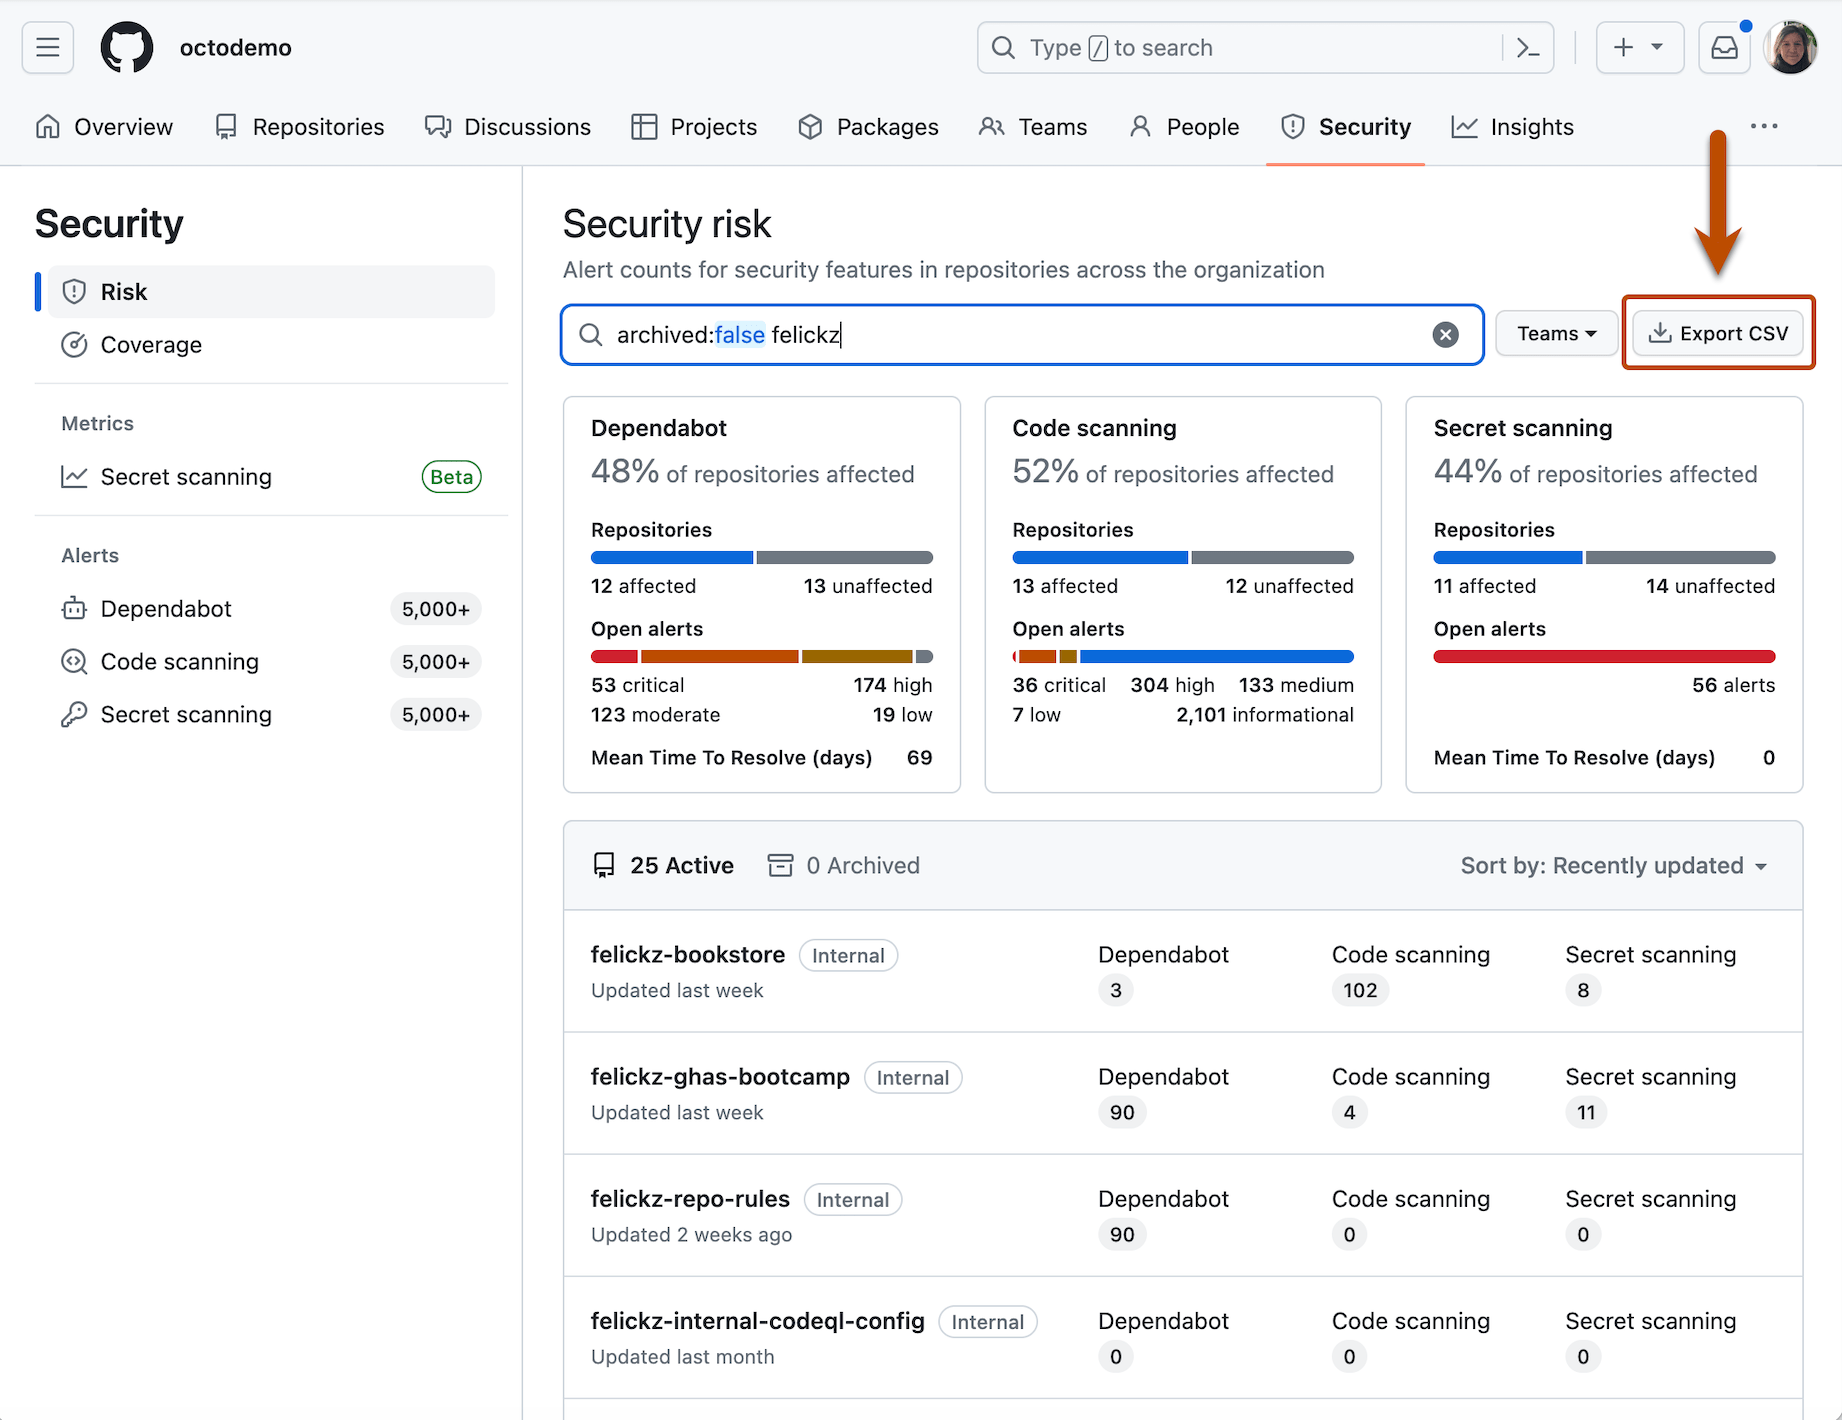
Today we are announcing the general availability of our organization and enterprise-level security risk and coverage pages.

Additionally, the alert-centric pages for Dependabot, code scanning, and secret scanning are also now generally available at both the organization and enterprise levels.

The enterprise-level security overview page has been replaced by the risk and coverage pages as previously announced. The risk page is designed to help you assess security exposure, and the coverage view is intended to help you manage security feature enablement.

To access the new enterprise-level risk and coverage pages, follow these steps:

  1. Navigate to your profile photo in the top-right corner of GitHub.com.
  2. Click Your enterprises.
  3. From the list of enterprises, select the enterprise you wish to view.
  4. In the enterprise account sidebar, click on Code Security.

These improvements have shipped to GitHub.com and will be available in GitHub Enterprise Server 3.10.

Learn more about the new risk and coverage pages and send us your feedback

See more

Today we are announcing the general availability of code scanning default setup enablement at the organization level.

Code scanning enable all default setup button on the organization's 'Settings' page

You can use code scanning default setup to enable CodeQL analysis for pull requests and pushes on eligible repositories without committing any workflow files. Currently, this feature is only available for repositories that use GitHub Actions and it supports analysis of JavaScript/TypeScript, Python, Ruby and Go. We plan to add support for additional languages soon.

This feature is also available as a public beta in GitHub Enterprise Server 3.9 and will be generally available in GitHub Enterprise Server 3.10.

Learn more about configuring code scanning at scale using CodeQL and the "Enable or disable a security feature for an organization" REST API
Learn more about GitHub Advanced Security

See more