Introducing GitHub Traffic Analytics
The holidays are over and we’re getting back into the shipping spirit at GitHub. We want to kick off 2014 with a bang, so today we’re happy to launch Traffic…
The holidays are over and we’re getting back into the shipping spirit at GitHub.
We want to kick off 2014 with a bang, so today we’re happy to launch Traffic analytics!
You can now see detailed analytics data for repositories that you’re an owner of or that you can push to. Just
load up the graphs page for your particular repository and you’ll see a new link to
the traffic page.
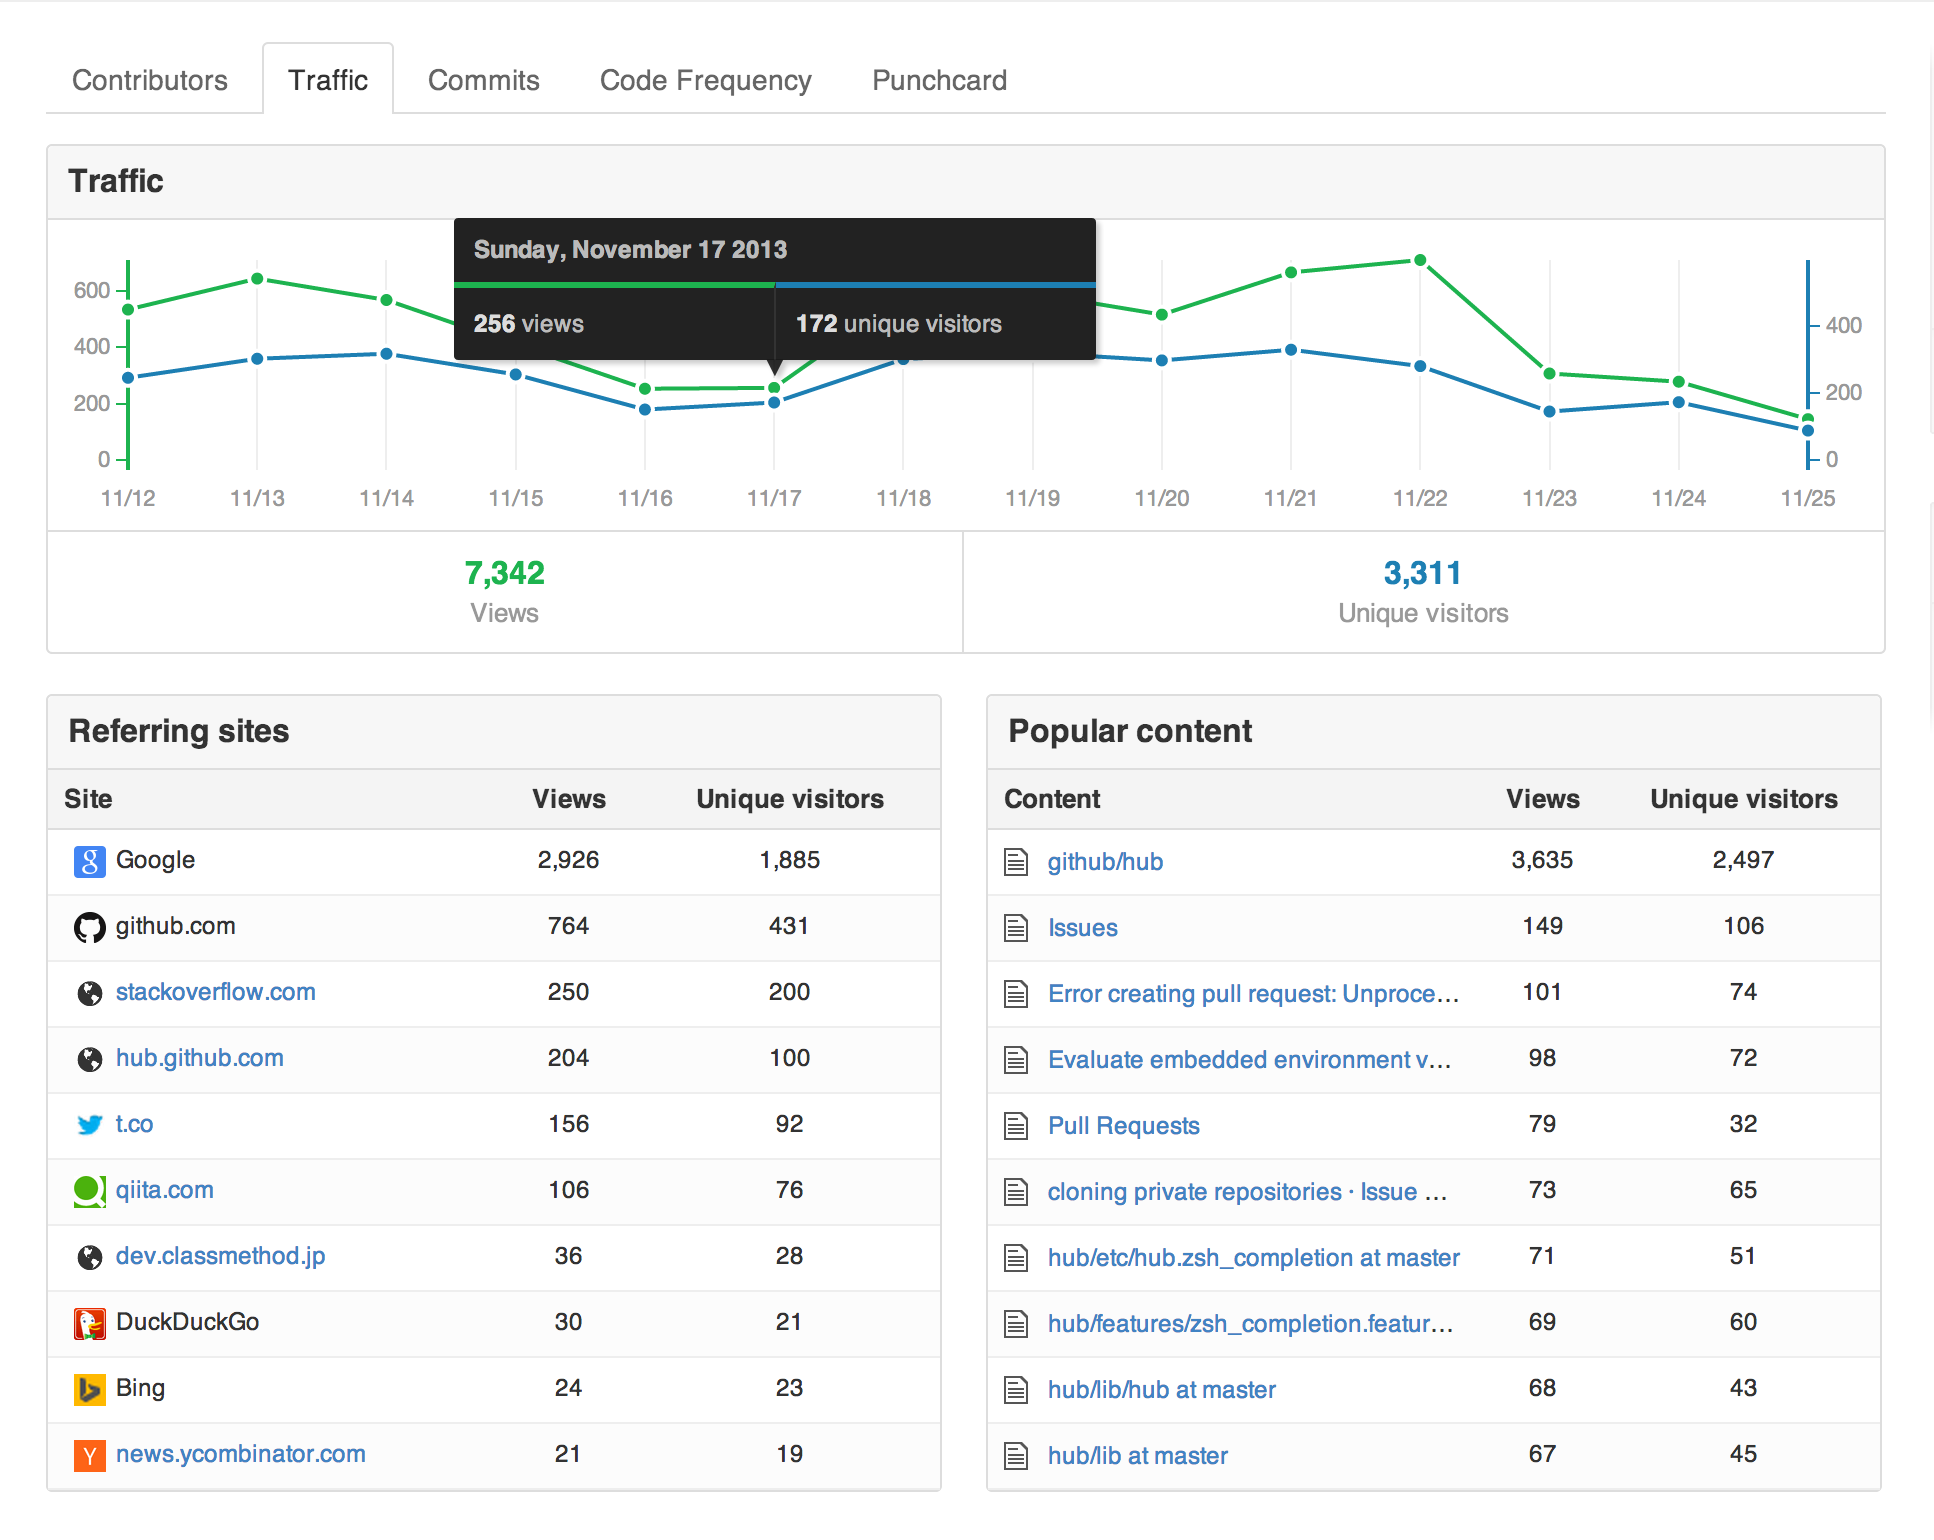
When you land on the traffic page you’ll see a lot of useful information about your
repositories including where people are coming from and what they’re viewing.
Looking at these numbers for our own repositories has been fun, sometimes surprising, and always interesting.
We hope you enjoy it as much as we have!
Written by

Related posts
We need a European Sovereign Tech Fund
Open source software is critical infrastructure, but it’s underfunded. With a new feasibility study, GitHub’s developer policy team is building a coalition of policymakers and industry to close the maintenance funding gap.
GitHub Availability Report: June 2025
In June, we experienced three incidents that resulted in degraded performance across GitHub services.

From pair to peer programmer: Our vision for agentic workflows in GitHub Copilot
AI agents in GitHub Copilot don’t just assist developers but actively solve problems through multi-step reasoning and execution. Here’s what that means.