See your CSVs
Following on the tails of 3D models and geographic data, GitHub.com now also supports rendering tabular data in the form of .csv (comma-separated) and .tsv (tab-separated) files. When viewed, any…
Following on the tails of 3D models and geographic data, GitHub.com now also supports rendering tabular data in the form of .csv (comma-separated) and .tsv (tab-separated) files.
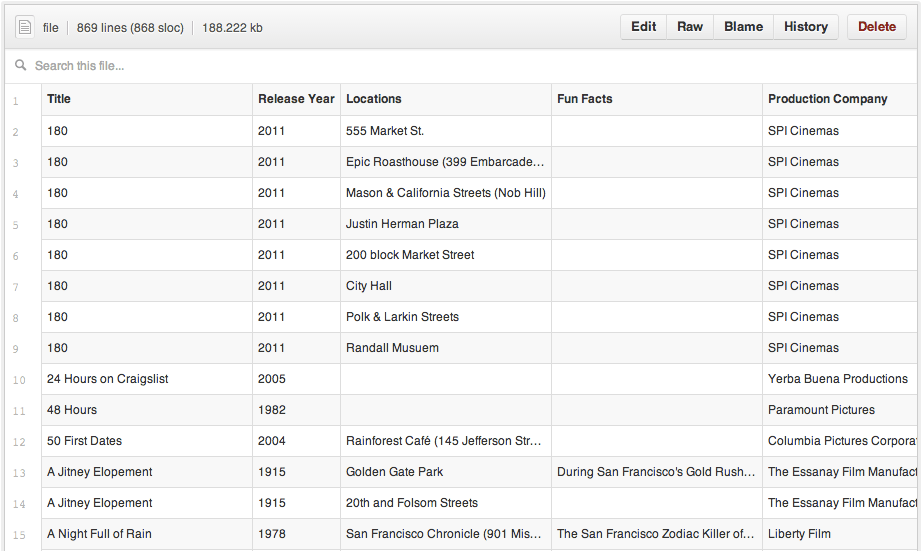
When viewed, any .csv or .tsv file committed to a GitHub repository will automatically render as an interactive table, complete with headers and row numbering.
You can even link to a particular row simply by clicking the row number, or select multiple rows by holding down the shift key. Just copy the URL and send it to a friend.
Want to see if a certain value is in your dataset? Just start typing and the data filters itself.
Building software is about more than code. Whether analyzing a government dataset, comparing performance benchmarks, or parsing crash reports, working with tabular data on GitHub just got a little bit easier.
For more information, check out our help article.
Happy Analyzing!
Written by

Related posts
We need a European Sovereign Tech Fund
Open source software is critical infrastructure, but it’s underfunded. With a new feasibility study, GitHub’s developer policy team is building a coalition of policymakers and industry to close the maintenance funding gap.
GitHub Availability Report: June 2025
In June, we experienced three incidents that resulted in degraded performance across GitHub services.

From pair to peer programmer: Our vision for agentic workflows in GitHub Copilot
AI agents in GitHub Copilot don’t just assist developers but actively solve problems through multi-step reasoning and execution. Here’s what that means.