A framework for building Open Graph images
We recently set about creating a framework and service for automatically generating social sharing images for repositories and other resources on GitHub.
You know that feeling when you make your latest hack project public, and you’re ready to share it with the world? And when you go to Twitter to post a link to your repository, you just see a big picture of yourself? We wanted to make that a better experience.
We recently set about creating a framework and service for automatically generating social sharing images for repositories and other resources on GitHub.
Before the update
Before, when you shared a link to a repository on any social media platform, you’d see something like this:

We heard from you that seeing the author’s face was unexpected. Plus, there’s not a lot of quick information here, aside from the plaintext title and description.
We do have custom repository images, and you can still use those to give your project some bespoke branding—but most people don’t upload a custom image for their repositories, so we wanted to create a better default experience for every repo on GitHub.
After the update
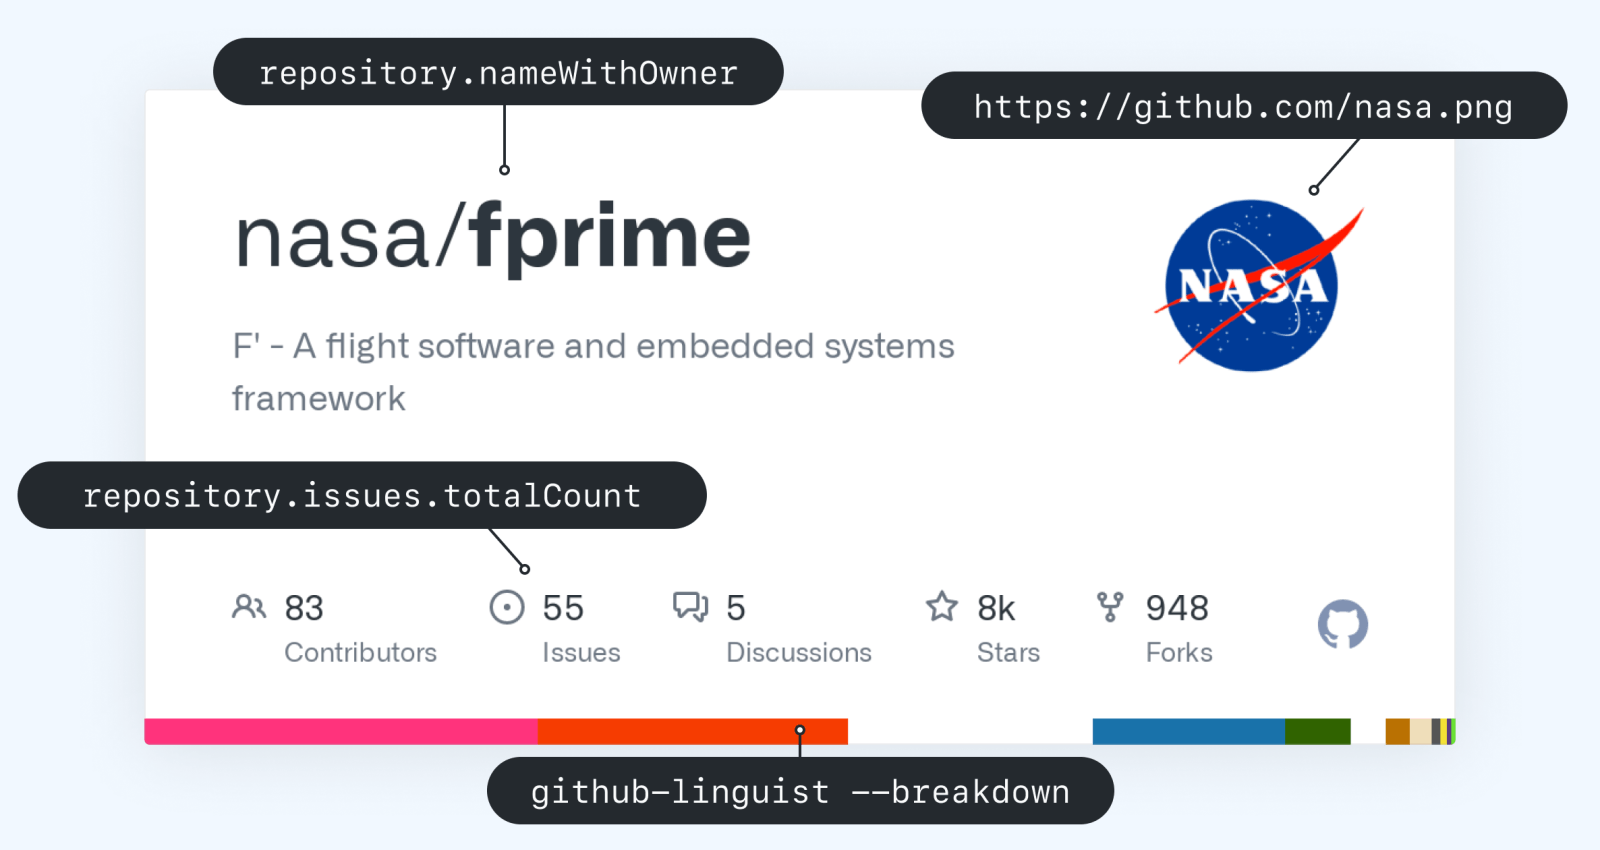
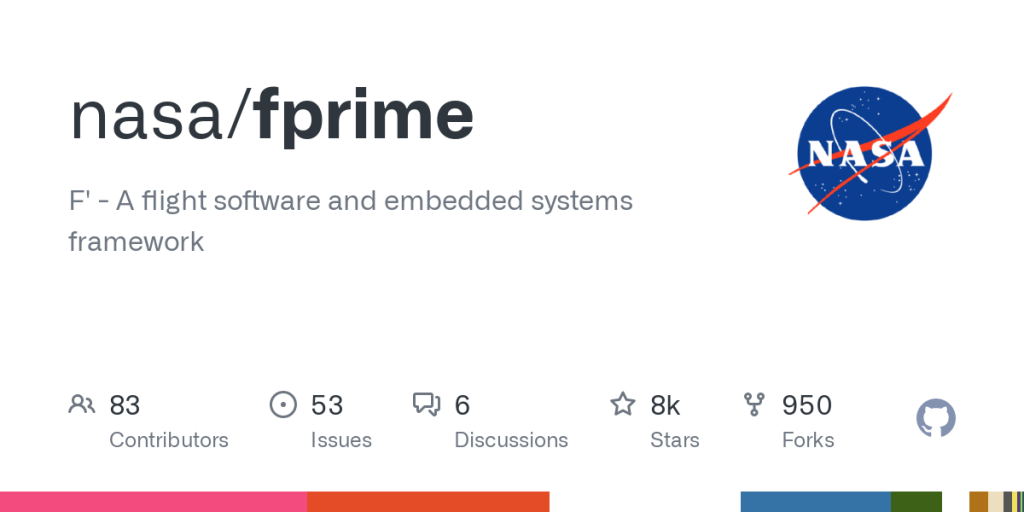
Now, we generate a new image for you on-the-fly when you share a link to a repository somewhere:
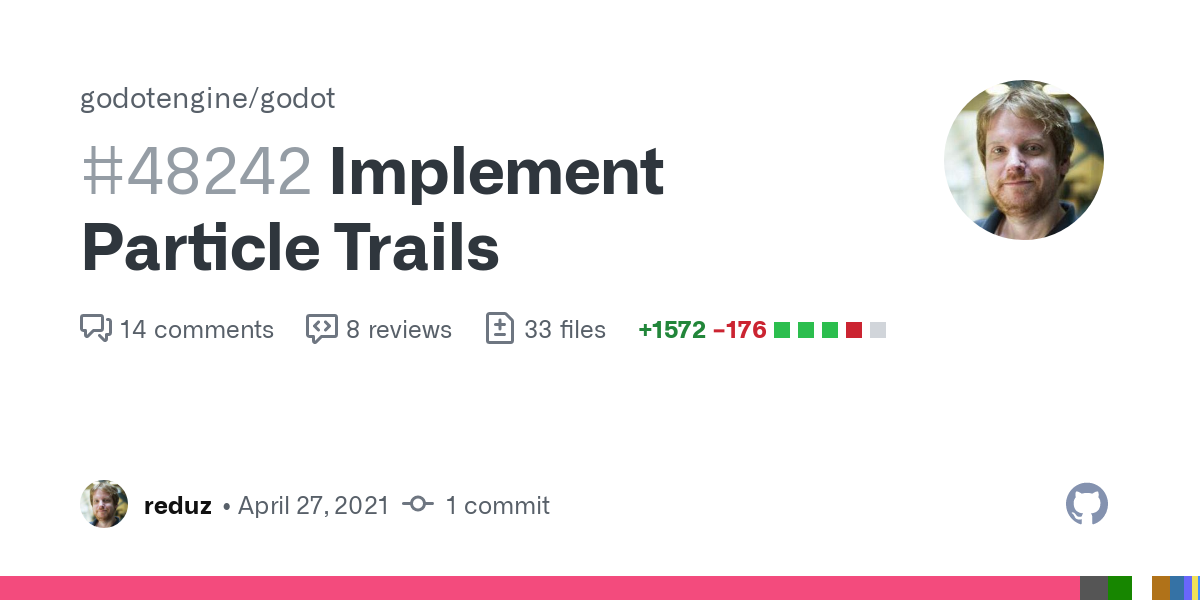
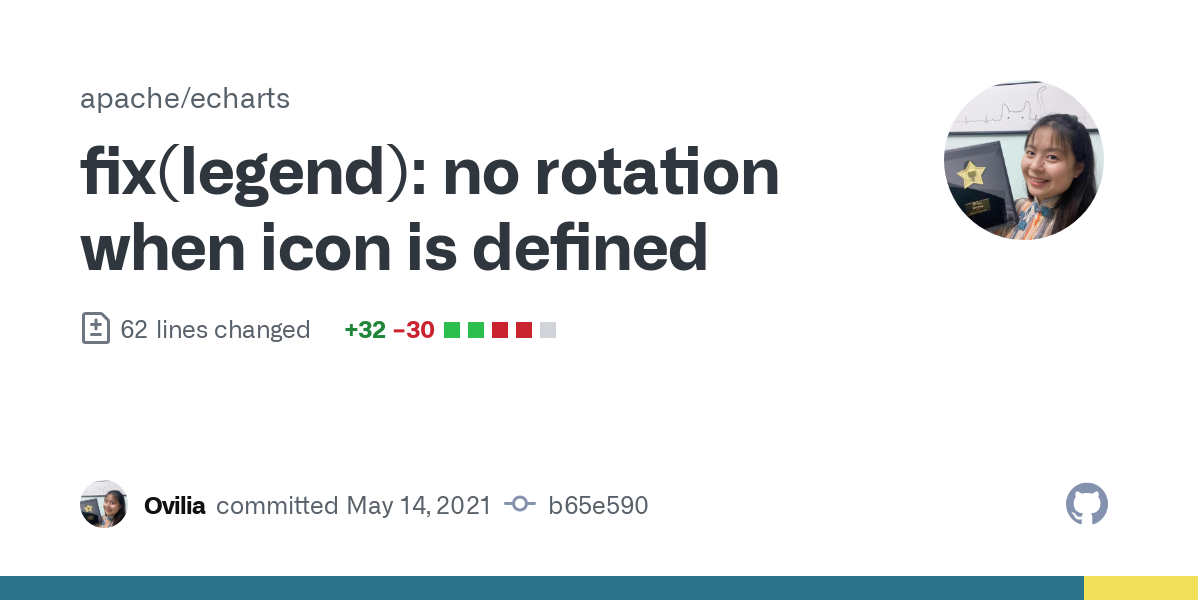
We create similar cards for issues, pull requests and commits, with more resources coming soon (like Discussions, Releases and Gists):
What’s going on behind the scenes? A quick intro to Open Graph
Open Graph is a set of standards for websites to be able to declare metadata that other platforms can pick out, to get a TL;DR of the page. You’d declare something like this in your HTML:
<meta property="og:image" content="https://www.rd.com/wp-content/uploads/2020/01/GettyImages-454238885-scaled.jpg" />In addition to the image, we also define a number of other meta tags that are used for rendering information outside of GitHub, like og:title and og:description.
When a crawler (like Twitter’s crawling bot, which activates any time you share a link on Twitter) looks at your page, it’ll see those meta tags and grab the image. Then, when that platform shows a preview of your website, it’ll use the information it found. Twitter is one example, but virtually all social platforms use Open Graph to unfurl rich previews for links.
How does the image generator work?
I’ll show you! We’ve leveraged the magic of open source technologies to string some tools together. There are a ton of services that do image templating on-demand, but we wanted to deploy our own within our own infrastructure, to ensure that we have the control we need to generate any kind of image.
So: our custom Open Graph image service is a little Node.js app that uses the GitHub GraphQL API to collect data, generates some HTML from a template, and pipes it to Puppeteer to “take a screenshot” of that HTML. This is not a novel idea—lots of companies and projects (like vercel/og-image) use a similar process to generate an image.
We have a couple of routes that match patterns similar to what you’d find on GitHub.com:
// https://github.com/rails/rails/pull/41080
router.get("/:owner/:repo/pull/:number", generateImageMiddleware(Pull));

// https://github.com/rails/rails/issues/41078
router.get("/:owner/:repo/issues/:number", generateImageMiddleware(Issue));

// https://github.com/rails/rails/commit/2afc9059c9eb509f47d94250be0a917059afa1ae
router.get("/:owner/:repo/commit/:oid", generateImageMiddleware(Commit));

// https://github.com/rails/rails/pull/41080/commits/2afc9059c9eb509f47d94250be0a917059afa1ae
router.get("/:owner/:repo/pull/:number/commits/:oid", generateImageMiddleware(Commit));

// https://github.com/rails/rails/*
router.get("/:owner/:repo*", generateImageMiddleware(Repository));
When our application receives a request that matches one of those routes, we use the GitHub GraphQL API to collect some data based on the route parameters and generate an image using code similar to this:
async function generateImage(template, templateData) {
 // Render some HTML from the relevant template
 const html = compileTemplate(template, templateData);

 // Create a new page
 const page = await browser.newPage();

 // Set the content to our rendered HTML
 await page.setContent(html, { waitUntil: "networkIdle0" });

 const screenshotBuffer = await page.screenshot({
   fullPage: false,
   type: "png",
 });

 await page.close();

 return screenshotBuffer;
}
Some performance gotchas
Puppeteer can be really slow—it’s launching an entire Chrome browser, so some slowness is to be expected. But we quickly saw some performance problems that we just couldn’t live with. Here are a couple of things we did to significantly improve performance of image generation:
waitUntil: networkIdle0 is aggressively patient, so we replaced it
One Saturday night, I was generating and digging through Chromium traces, as one does, to determine why this service was so slow. I dug into these traces with the help of Electron maintainer and semicolon enthusiast @MarshallOfSound. We discovered a huge, two-second block of idle time (in pink):
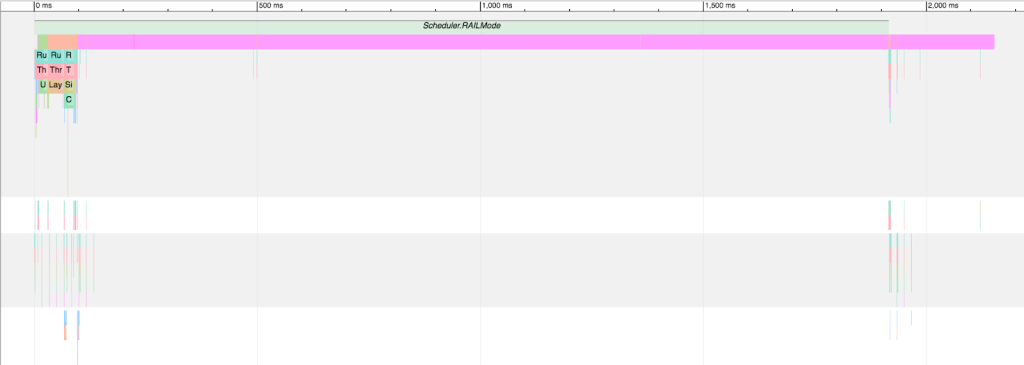
That’s a trace of everything between browser.newPage() and page.close(). The giant pink bar is “idle time,” and (through trial and error) we determined that this was the waitUntil: networkidle0 option passed to page.setContent(). We needed to set this option to say “only continue once all images, fonts, etc have finished loading,” so that we don’t take screenshots before the pages are actually ready. However, it seemed to add a significant amount of idle time, despite the page being ready for a screenshot 300ms in. Per networkidle0‘s docs:
networkidle0– consider setting content to be finished when there are no more than 0 network connections for at least 500 ms.
We deduced that that big pink block was due to Puppeteer’s backoff time, where it waits 500ms before considering all network connections complete; but the numbers didn’t really line up. That pink bar shouldn’t be nearly that big, at around two seconds instead of the expected 500-ish milliseconds.
So, how did we fix it? Well, we want to wait until all images/fonts have loaded, but clearly Puppeteer’s method of doing so was a little greedy. It’s hard to see in a still image, but the below screenshot shows that all images have been decoded and render by about ~115ms into the trace:
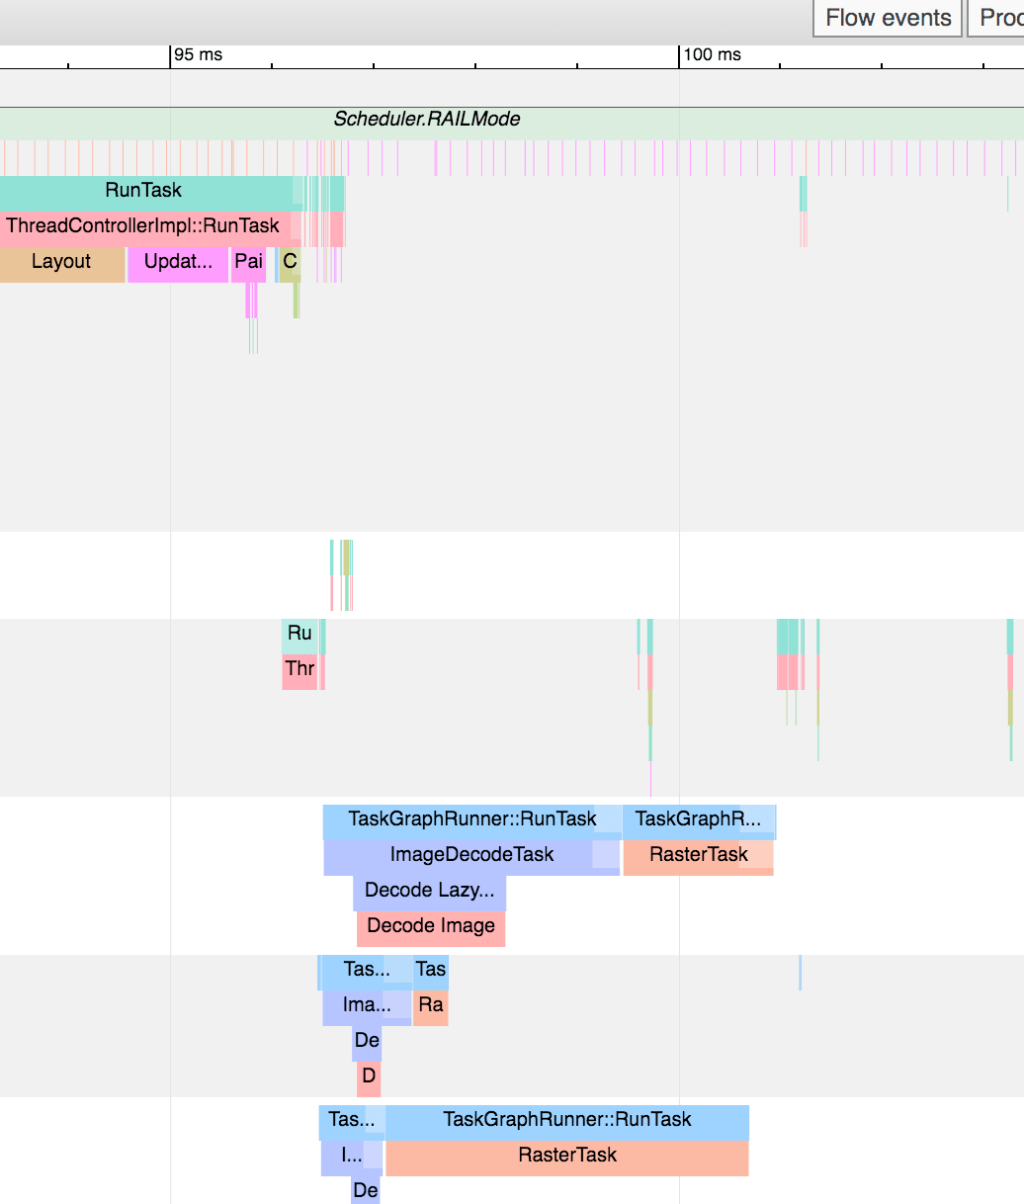
All we had to do was provide Puppeteer with a different heuristic to know when the page was “done” and ready for a screenshot. Here’s what we came up with:
   // Set the content to our rendered HTML
   await page.setContent(html, { waitUntil: "domcontentloaded" });

   // Wait until all images and fonts have loaded
   await page.evaluate(async () => {
     const selectors = Array.from(document.querySelectorAll("img"));
     await Promise.all([
       document.fonts.ready,
       ...selectors.map((img) => {
         // Image has already finished loading, let’s see if it worked
         if (img.complete) {
           // Image loaded and has presence
           if (img.naturalHeight !== 0) return;
           // Image failed, so it has no height
           throw new Error("Image failed to load");
         }
         // Image hasn’t loaded yet, added an event listener to know when it does
         return new Promise((resolve, reject) => {
           img.addEventListener("load", resolve);
           img.addEventListener("error", reject);
         });
       }),
     ]);
   });
This isn’t magic—it’s standard DOM practices. But it was a much better solution for our use-case than the abstraction provided by Puppeteer. We changed waitUntil to domcontentloaded to ensure that the HTML had finished being parsed, then passed a custom function to page.evaluate. This gets run in the context of the page itself but pipes the return value to the outer context. This meant that we could listen for image load events and pause execution until the Promises have been resolved.
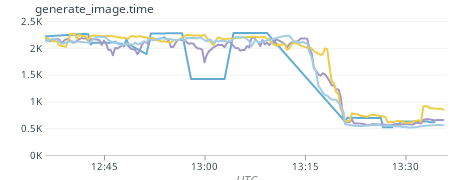
You can see the difference in our performance graphs (going from ~2.25 seconds to ~600ms):
Double your rendering speed with 1mb of memory
More memory means more speed, right? Sure! At GitHub, when we deploy a new service to our internal Kubernetes infrastructure, it gets a default amount of memory: 512MB (technically MiB, but who’s counting?). When we were scaling this service to be enabled for 100% of repositories, we wanted to increase our resource limits to ensure we didn’t see any performance degradations as the service saw more traffic. What we didn’t know was that 512MB was a magic number – and that setting our memory limit to at least 1MB more would unlock significantly better performance within Chromium.
When we bumped that limit, we saw this change:
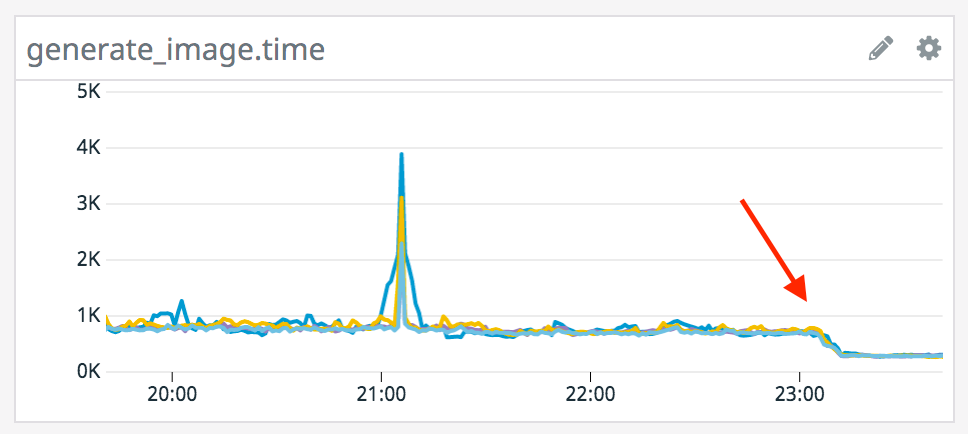
In production, that was a reduction of almost 500ms to generate an image. It stands to reason that more memory will be “faster” but not that much without any increase in traffic—so what happened? Well, it turns out that Chromium has a flag for devices with less than 512MB of memory and considers these low-spec devices. Chromium uses that flag to run some processes sequentially instead of in parallel, to improve reliability at the cost of performance on devices that couldn’t support increased performance anyway. If you’re interested in running a service like this on your own, check to see if you can bump the memory limit past 512MB – the results are pretty great!
Stats
Generating an image takes 280ms on average. We could go even lower if we wanted to make some other changes, like generating a JPEG instead of a PNG.
The image generator service generates around two million unique-ish images per day. We also return a cached image for 40% of the total requests.
And that’s it! I hope you’re enjoying these images in your Twitter feeds. I know it’s made mine a lot more colorful. If you have any questions or comments, feel free to ping me on Twitter: @JasonEtco!
Tags:
Written by
Related posts

From first commits to big ships: Tune into our new open source podcast
Introducing the brand new GitHub Podcast: A show dedicated to the topics, trends, stories, and culture in and around the open source developer community on GitHub.

Scaling for impact: How GitHub Copilot supercharges smallholder farmers
Empowering 10 million farm families by 2030 to generate $1 billion in new revenue. How GitHub helps One Acre Fund’s mission — driving real impact across Africa.

We need a European Sovereign Tech Fund
Open source software is critical infrastructure, but it’s underfunded. With a new feasibility study, GitHub’s developer policy team is building a coalition of policymakers and industry to close the maintenance funding gap.