Hey Judy, don’t make it bad
Last week we explained how we greatly reduced the rendering time of our web views by switching our escaping routines from Ruby to C. This speed-up was two-fold: the C…
Last week we explained how we greatly reduced the rendering time of our web views by switching our escaping routines from Ruby to C. This speed-up was two-fold: the C code for escaping HTML was significantly faster than its Ruby equivalent, and on top of that, the C code was generating a lot fewer objects on the Ruby heap, which meant that subsequent garbage collection runs would run faster.
When working with a mark and sweep garbage collector (like the one in MRI), the amount of objects in the Heap at any given moment of time matters a lot. The more objects, the longer each GC pause will take (all the objects must be traversed during the Mark phase!), and since MRI’s garbage collector is also “stop the world”, while GC is running Ruby code cannot be executing, and hence web requests cannot be served.
In Ruby 1.9 and 2.0, the ObjectSpace module contains useful metadata regarding the current state of the Garbage collector and the Ruby Heap. Probably the most useful method provided by this module is count_objects, which returns the amount of objects allocated in the Ruby heap, separated by type: this offers a very insightful birds-eye view of the current state of the heap.
We tried running count_objects on a fresh instance of our main Rails application, as soon as all the libraries and dependencies were loaded:
GitHub.preload_all
GC.start
count = ObjectSpace.count_objects

puts count[:TOTAL] - count[:FREE]
#=> 605183
Whelp! More than 600k Ruby objects allocated just after boot! That’s a lotta heap, like we say in my country. The obvious question now is whether all those objects on the heap are actually necessary, and whether we can free or simply prevent from allocating some of them to reduce our garbage collection times.
This question, however, is rather hard to answer by using only the ObjectSpace module. Although it offers an ObjectSpace#each_object method to enumerate all the objects that have been allocated, this enumeration is of very little use because we cannot tell where each object was allocated and why.
Fortunately, @tmm1 had a master plan one more time. With a few lines of code, he added a __sourcefile__ and __sourceline__ method to every single object in the Kernel, which kept track of the file and line in which the object was allocated. This is priceless: we are now able to iterate through every single object in the Ruby Heap and pinpoint and aggregate its source of allocation.
GitHub.preload_all
GC.start
ObjectSpace.each_object.to_a.inject(Hash.new 0){ |h,o| h["#{o.__sourcefile__}:#{o.class}"] += 1; h }.
  sort_by{ |k,v| -v }.
  first(10).
  each{ |k,v| printf "% 6d  |  %sn", v, k }
36244 | lib/ruby/1.9.1/psych/visitors/to_ruby.rb:String
28560 | gems/activesupport-2.3.14.github21/lib/active_support/dependencies.rb:String
26038 | gems/actionpack-2.3.14.github21/lib/action_controller/routing/route_set.rb:String
19337 | gems/activesupport-2.3.14.github21/lib/active_support/multibyte/unicode_database.rb:ActiveSupport::Multibyte::Codepoint
17279 | gems/mime-types-1.19/lib/mime/types.rb:String
10762 | gems/tzinfo-0.3.36/lib/tzinfo/data_timezone_info.rb:TZInfo::TimezoneTransitionInfo
10419 | gems/actionpack-2.3.14.github21/lib/action_controller/routing/route.rb:String
9486 | gems/activesupport-2.3.14.github21/lib/active_support/dependencies.rb:RubyVM::InstructionSequence
8459 | gems/actionpack-2.3.14.github21/lib/action_controller/routing/route_set.rb:RubyVM::InstructionSequence
5569 | gems/actionpack-2.3.14.github21/lib/action_controller/routing/builder.rb:StringOh boy, let’s take a look at this in more detail. Clearly, there are allocation sources which we can do nothing about (the Rails core libraries, for example), but the biggest offender here looks very interesting. Psych is the YAML parser that ships with Ruby 1.9+, so apparently something is parsing a lot of YAML and keeping it in memory at all times. Who could this be?
A Pocket-size Library of Babel
Linguist is an open-source Ruby gem which we developed to power our language statistics for GitHub.com.
People push a lot of code to GitHub, and we needed a reliable way to identify and classify all the text files which we display on our web interface. Are they actually source code? What language are they written in? Do they need to be highlighted? Are they auto-generated?
The first versions of Linguist took a pretty straightforward approach towards solving these problems: definitions for all languages we know of were stored in a YAML file, with metadata such as the file extensions for such language, the type of language, the lexer for syntax highlighting and so on.
However, this approach fails in many important corner cases. What’s in a file extension? that which we call .h by any other extension would take just as long to compile. It could be C, or it could be C++, or it could be Objective-C. We needed a more reliable way to separate these cases, and hundreds of other ambiguous situations in which file extensions are related to more than one programming language, or source files do not even have an extension.
That’s why we decided to augment Linguist with a very simple classifier: Armed with a pocket-size Library of Babel of Code Samples (that is, a collection of source code files from different languages hosted in GitHub) we attempted to perform a weighted classification of all the new source code files we encounter.
The idea is simple: when faced with a source code file which we cannot recognize, we tokenize it, and then use a weighted classifier to find out the likehood that those tokens in the file belong to a given programming language. For example, an #include token is very likely to belong to a C or a C++ file, and not to a Ruby file. A class token can very well belong to a C++ file or a Ruby file, but if we find both an #include and a class token on the same file, then the answer is most definitely C++.
Of course, to perform this classification, we need to keep in memory a large list of tokens for every programming language that is hosted on GitHub, and their respective probabilities. It was this collection of tokens which was topping our allocation meters for the Ruby Garbage collector. For the classifier to be accurate, it needs to be trained with a large dataset –the bigger the better–, and although 36000 token samples are barely enough for training a classifier, they are a lot for the poor Ruby heap.
Take a slow classifier and make it better
We had a very obvious plan to fix this issue: move the massive token dataset out of the Ruby Heap and into native C-land, where it doesn’t need to be garbage collected, and keep it as compact as possible in memory.
For this, we decided to store the tokens in a Judy Array, a trie-like data structure that acts as an associative array or key-value store with some very interesting performance characteristics.
As opposed to traditional trie-like data structures storing strings, branches happen at the bit-level (i.e. the Judy Array acts as a 256-ary trie), and their nodes are highly compressed: the claim is that thanks to this compression, Judy Arrays can be packed extremely tightly in cache lines, minimizing the amount of cache misses per lookup. The supposed result of this are lookup times that can compete against a hash table, even though the algorithmic complexity of Judy Arrays is O(log n), like any other trie-like structure.
Of course, there is no real-world silver bullet when it comes to algorithmic performance, and Judy Arrays are no exception. Despite the claims in Judy’s original whitepaper, cache misses in modern CPU architectures do not fetch data stored in the Prison of Azkaban; they fetch it from the the L2 cache, which happens to be oh-not-that-far-away.
In practice, this means that the constant loss of time caused by a few (certainly not many) cache misses in a hash table lookups (O(1)) is not enough to offset the lookup time in a Judy array (O(log n)), no matter how tightly packed it is. On top of that, on hash tables with linear probing and a small step size, the point of reduced cache misses becomes moot, as most of the time collisions can be resolved in the same cache line where they happened. These practical results have been proven over and over again in real-world tests. At the end of the day, a properly tuned hash table will always be faster than a Judy Array.
Why did we choose Judy arrays for the implementation, then? For starters, our goal right now is not related to performance (classification is usually not a performance critical operation), but to maximizing the size of the training dataset while minimizing its memory usage. Judy Arrays, thanks to their remarkable compression techniques, store the keys of our dataset in a much smaller chunk of memory and with much less redundancy than a hash table.
Furthermore, we are pitting Judy Arrays against MRI’s Hash Table implementation, which is known to be not particularly performant. With some thought on the way the dataset is stored in memory, it becomes feasible to beat Ruby’s hash tables at their own game, even if we are performing logarithmic lookups.
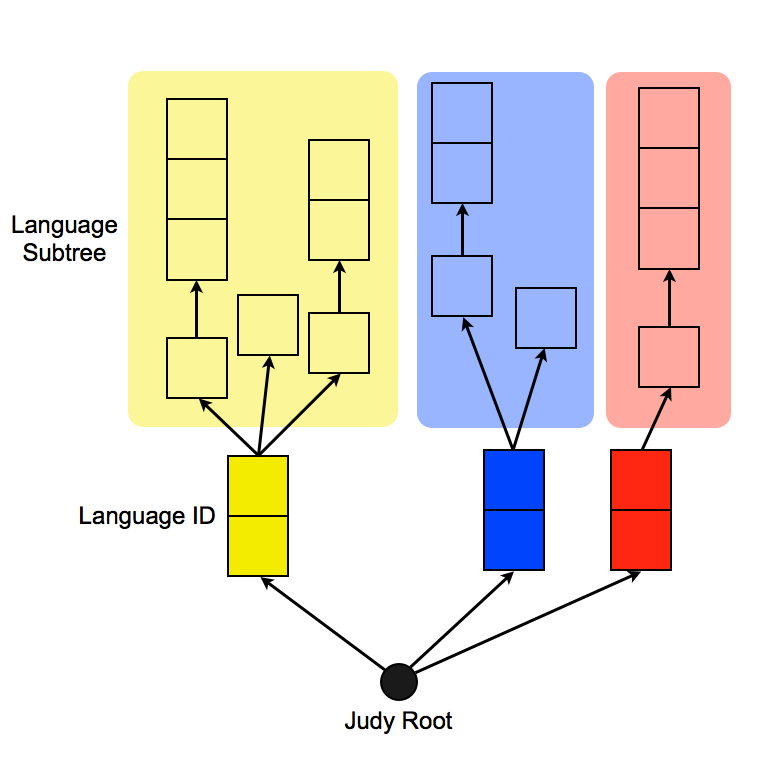
The main design constraint for this problem is that the tokens in the dataset need to be separated by language. The YAML file we load in memory takes the straightforward approach of creating one hash table per language, containing all of its tokens. We can do better using a trie structure, however: we can store all the tokens in the same Judy Array, but prefixing them with an unique 2-byte prefix that identifies their language. This creates independent subtrees of tokens inside the same global data structure for each different language, which increases cache locality and reduces the logarithmic cost of lookups.

For the average query behavior of the dataset (burst lookups of thousands of tokens of the same language in a row), having these subtrees means keeping the cache permanently warm, and minimzing the amount of traversals around the Array, since the internal Judy cursor never leaves the subtree for a language between queries.
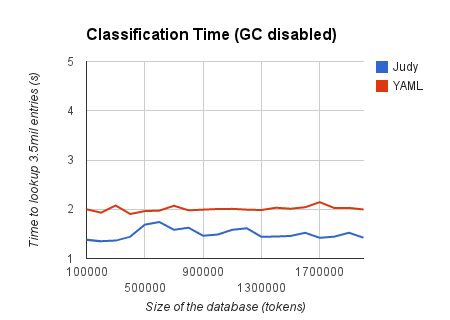
The results of this optimization are much more positive than what we’d expect from benchmarking a logarithmic time structure against one which allegedly performs lookups in constant time:

In this benchmark where we have disabled MRI’s garbage collector, we can see how the lookup of 3.5 million tokens on the database stays more than 50% faster against the Hash Table, even as we artificially increase the dataset with random tokens. Thanks to the locality of the token subtrees per language, lookup times remain mostly constant and don’t exhibit a logarithmic behavior.
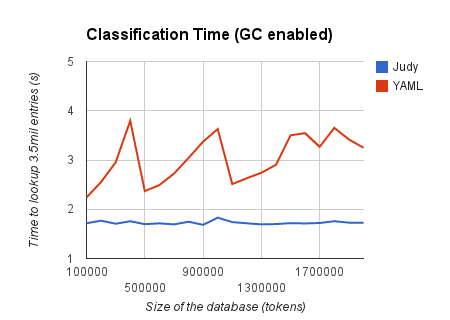
Things get even better for Judy Arrays when we enable the garbage collector and GC cycles start being triggered between lookups:

Here we can see how the massive size of the data structures in the Ruby Heap cause the garbage collector to go bananas, with huge spikes in lookup times as the dataset increases and GC runs are triggered. The Judy Array (stored outside the Ruby Heap) remains completely unfazed by it, and what’s more, manages to maintain its constant lookup time while Hash Table lookups become more and more expensive because of the higher garbage collection times.
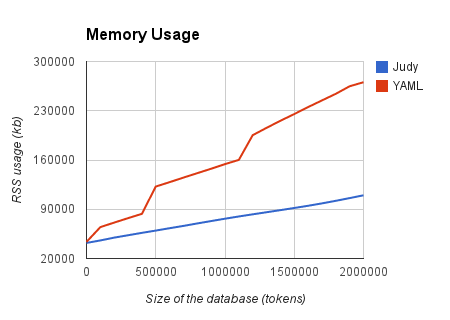
The cherry on top comes from graphing the RSS usage of our Ruby process as we increase the size of our dataset:

Once again (and this time as anticipated), Judy Arrays throw MRI’s Hash Table implementation under a bus. Their growth remains very much linear and increases extremely slowly, while we can appreciate considerable bumps and very fast growth as hash tables get resized.
GC for the jilted generation
With the new storage engine for tokens on Linguist’s classifier, we are now able to dramatically expand our sampling dataset. A bigger dataset means more accurate classification of programming languages and more accurate language graphs on all repositories; this makes GitHub more awesome.
The elephant in the room still lives on in the shape of MRI’s garbage collector, however. Without a generational GC capable of finding and marking roots of the Heap that are very unlikely to be freed (if at all), we must keep permanent attention to the amount of objects we allocate on our main app. More objects not only mean higher memory usage: they also mean higher garbage collection times and slower requests.
The good news is that Koichi Sasada has recently proposed a Generational Garbage Collector for inclusion in MRI 2.1. This prototype is remarkable because it allows a subset of generational garbage collection to happen while maintaining compatibility with MRI’s current C extension API, which in its current iteration has several trade-offs (for the sake of simplicity when writing extensions) that make memory management for internal objects extremely difficult.
This compatibility with older versions, of course, comes at a price. Objects in the heap now need to be separated between “shady” and “sunny”, depending on whether they have write barriers or not, and hence whether they can be generationally collected. This enforces an overly complicated implementation of the GC interfaces (several Ruby C APIs must drop the write barrier from objects when they are used), and the additional bookkeeping needed to separate the different kind of objects creates performance regressions under lighter GC loads. On top of that, this new garbage collector is also forced to run expensive Mark & Sweep phases for the young generation (as opposed to e.g. a copying phase) because of the design choices that make the current C API support only conservative garbage collection.
Despite the best efforts of Koichi and other contributors, Ruby Core’s concern with backwards compatibility (particularly regarding the C Extension API) keeps MRI lagging more than a decade behind Ruby implementations like Rubinius and JRuby which already have precise, generational and incremental garbage collectors.
It is unclear at the moment whether this new GC on its current state will make it into the next version of MRI, and whether it will be a case of “too little, too late” given the many handicaps of the current implementation. The only thing we can do for now is wait and see… Or more like wait and C. HAH. Amirite guys? Amirite?
Written by
Related posts

Apply now for GitHub Universe 2023 micro-mentoring
As part of our ongoing commitment to accelerate human progress through Social Impact initiatives, we’re offering students 30-minute, 1:1 micro-mentoring sessions with GitHub employees ahead of Universe.

The 2023 Open Source Program Office (OSPO) Survey is live!
Help quantify the state of enterprise open source by taking the 2023 OSPO survey.

Godot 4.0 Release Party 🎉
We are delighted to host the Godot 4.0 Release Party at GitHub HQ on Wednesday, March 22 from 6:30 pm to 9:30 pm. And you’re invited!