Introducing the New GitHub Graphs
Translations: Ukrainian. We’ve revamped our existing graphs and added three new graphs to help you discover even more about GitHub hosted repositories. Contributors See who’s contributing to a project and…
Translations: Ukrainian.
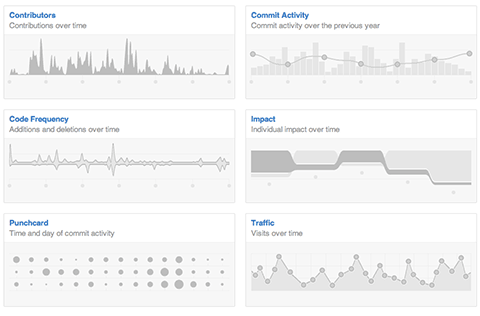
We’ve revamped our existing graphs and added three new graphs to help you discover even more about GitHub hosted repositories.
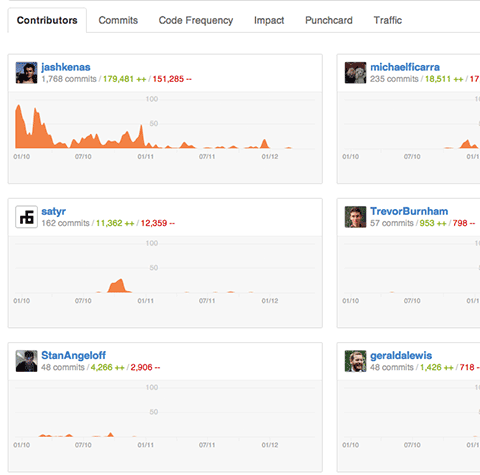
Contributors
See who’s contributing to a project and their contributions relative to other contributors.
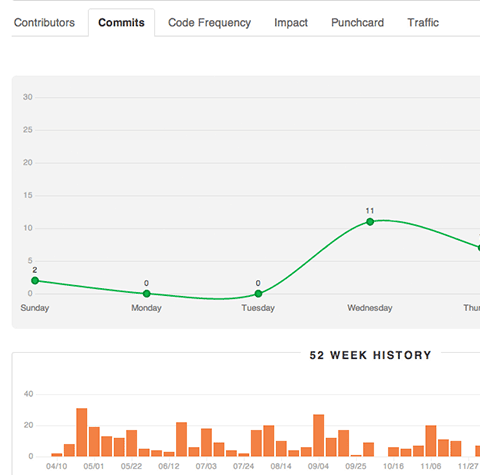
Commit Activity
Commit activity for the past year with a week by week breakdown.
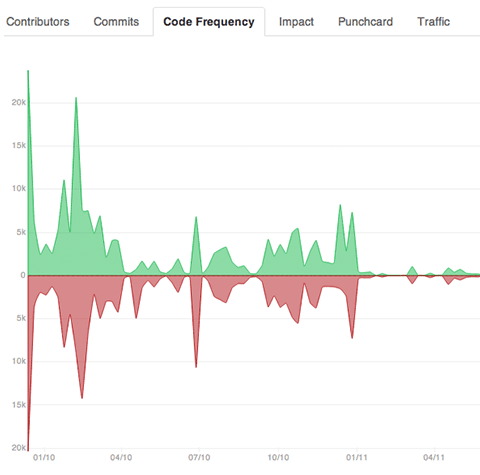
Code Frequency
See additions and deletions over the lifetime of a project.
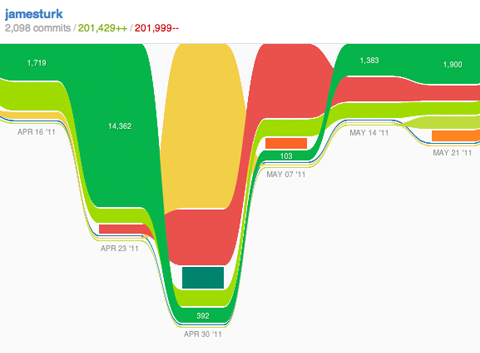
Impact
See individual impact over time. Historical update: The Impact graph is no longer a GitHub feature
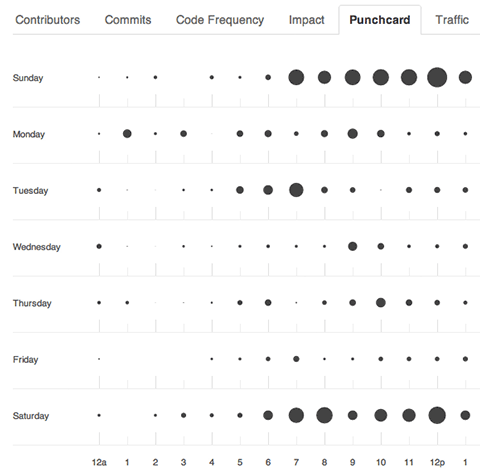
Punchcard
See the hour and day when commits are most frequent.
The new GitHub graphs are built with the amazing d3 library by @mbostock.
Written by
Related posts

Apply now for GitHub Universe 2023 micro-mentoring
As part of our ongoing commitment to accelerate human progress through Social Impact initiatives, we’re offering students 30-minute, 1:1 micro-mentoring sessions with GitHub employees ahead of Universe.

The 2023 Open Source Program Office (OSPO) Survey is live!
Help quantify the state of enterprise open source by taking the 2023 OSPO survey.

Godot 4.0 Release Party 🎉
We are delighted to host the Godot 4.0 Release Party at GitHub HQ on Wednesday, March 22 from 6:30 pm to 9:30 pm. And you’re invited!
