Retiring Impact Graphs
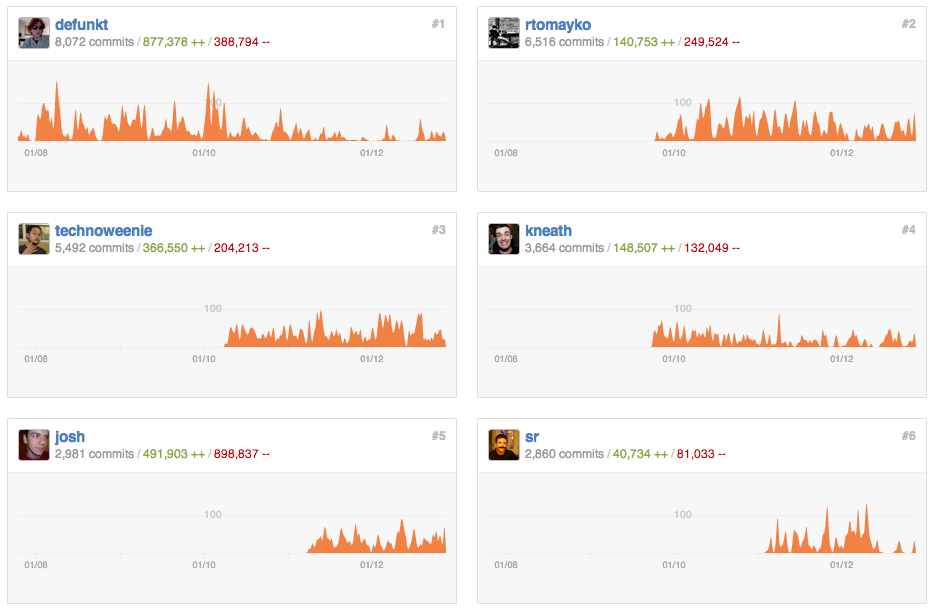
Back in April, we launched some amazing new graphs. One of the new visualizations we’ve found especially useful is the contributors page. We’re constantly looking at it to get a…
Back in April, we launched some amazing new graphs.
One of the new visualizations we’ve found especially useful is the
contributors page.
We’re constantly looking at it to get a sense of activity on our projects. It’s
a great way to see who’s contributing and how much of an impact they’re having
relative to other members of a project. The contributors page today is a much
better impact graph than the impact graph ever was.
So today, after four years in service, we’re retiring the impact graph.
Contributors to github

Check out the contributions page of a few of our favorite repositories:
Written by
Related posts

Apply now for GitHub Universe 2023 micro-mentoring
As part of our ongoing commitment to accelerate human progress through Social Impact initiatives, we’re offering students 30-minute, 1:1 micro-mentoring sessions with GitHub employees ahead of Universe.

The 2023 Open Source Program Office (OSPO) Survey is live!
Help quantify the state of enterprise open source by taking the 2023 OSPO survey.

Godot 4.0 Release Party 🎉
We are delighted to host the Godot 4.0 Release Party at GitHub HQ on Wednesday, March 22 from 6:30 pm to 9:30 pm. And you’re invited!